

Open rates, click-through rates, bounce rates, conversions, unsubscribe rates, and dozens of other metrics are available in almost every email marketing platform. But which metrics actually deserve your attention? Modern email marketing operates in an environment shaped by email privacy features, AI-powered inboxes, evolving mailbox provider algorithms, and stricter sender requirements. As a result, metrics that marketers relied on for years, such as open rates, no longer provide the complete picture, while deliverability, subscriber engagement, and revenue-focused metrics have become increasingly important for evaluating campaign success.
Tracking email marketing metrics is only valuable when the data is interpreted correctly. A high delivery rate does not necessarily mean emails reached subscriber inboxes, and open rates may not accurately represent subscriber engagement due to modern privacy features. Understanding the purpose and limitations of each metric enables businesses to evaluate campaign performance more effectively.
This guide explores the email marketing metrics that matter most in 2026, what they reveal about your campaigns, and how to improve them. By focusing on the right metrics, businesses can improve deliverability, increase subscriber engagement, and achieve stronger email marketing results.
What Are Email Marketing Metrics?
Email marketing metrics are measurable data that help evaluate the performance of your email campaigns. They provide insights into subscriber engagement, email deliverability, and the overall impact of your campaigns on business goals.
These metrics are generally grouped into three categories:
- Email Engagement Metrics: Measure how subscribers interact with your emails.
- Email Deliverability Metrics: Measure whether your emails successfully reach recipients.
- Email Business Metrics: Measure how email campaigns contribute to conversions, revenue, and overall business growth.
Key Email Marketing Metrics
Each email marketing metric measures a different aspect of campaign performance. Understanding these metrics together helps you evaluate email marketing performance, identify areas for improvement, and optimize future campaigns in 2026.
Email Engagement Metrics
Email engagement metrics measure how recipients interact with your emails after delivery. They help answer important questions such as whether subscribers are opening your emails, clicking your links, engaging with your content, or opting out of future communications. These insights help businesses evaluate how well their email campaigns resonate with their audience and identify opportunities to improve engagement.
However, no single engagement metric provides a complete picture of campaign performance. Modern email privacy features, automated security gateways, and AI-powered inbox technologies can generate artificial opens and automated link clicks, making some metrics less reliable when viewed on their own. Instead of relying on a single metric, businesses should analyze engagement metrics together to distinguish genuine subscriber behavior from automated activity, identify trends and make better optimization decisions.
1. Open Rate
For many years, Open Rate was the primary metric for measuring email engagement. It helped marketers evaluate the effectiveness of subject lines and estimate how many recipients were interested enough to open an email.
Open Rate = (Number of Recipients Who Opened the Email ÷ Number of Delivered Emails) × 100
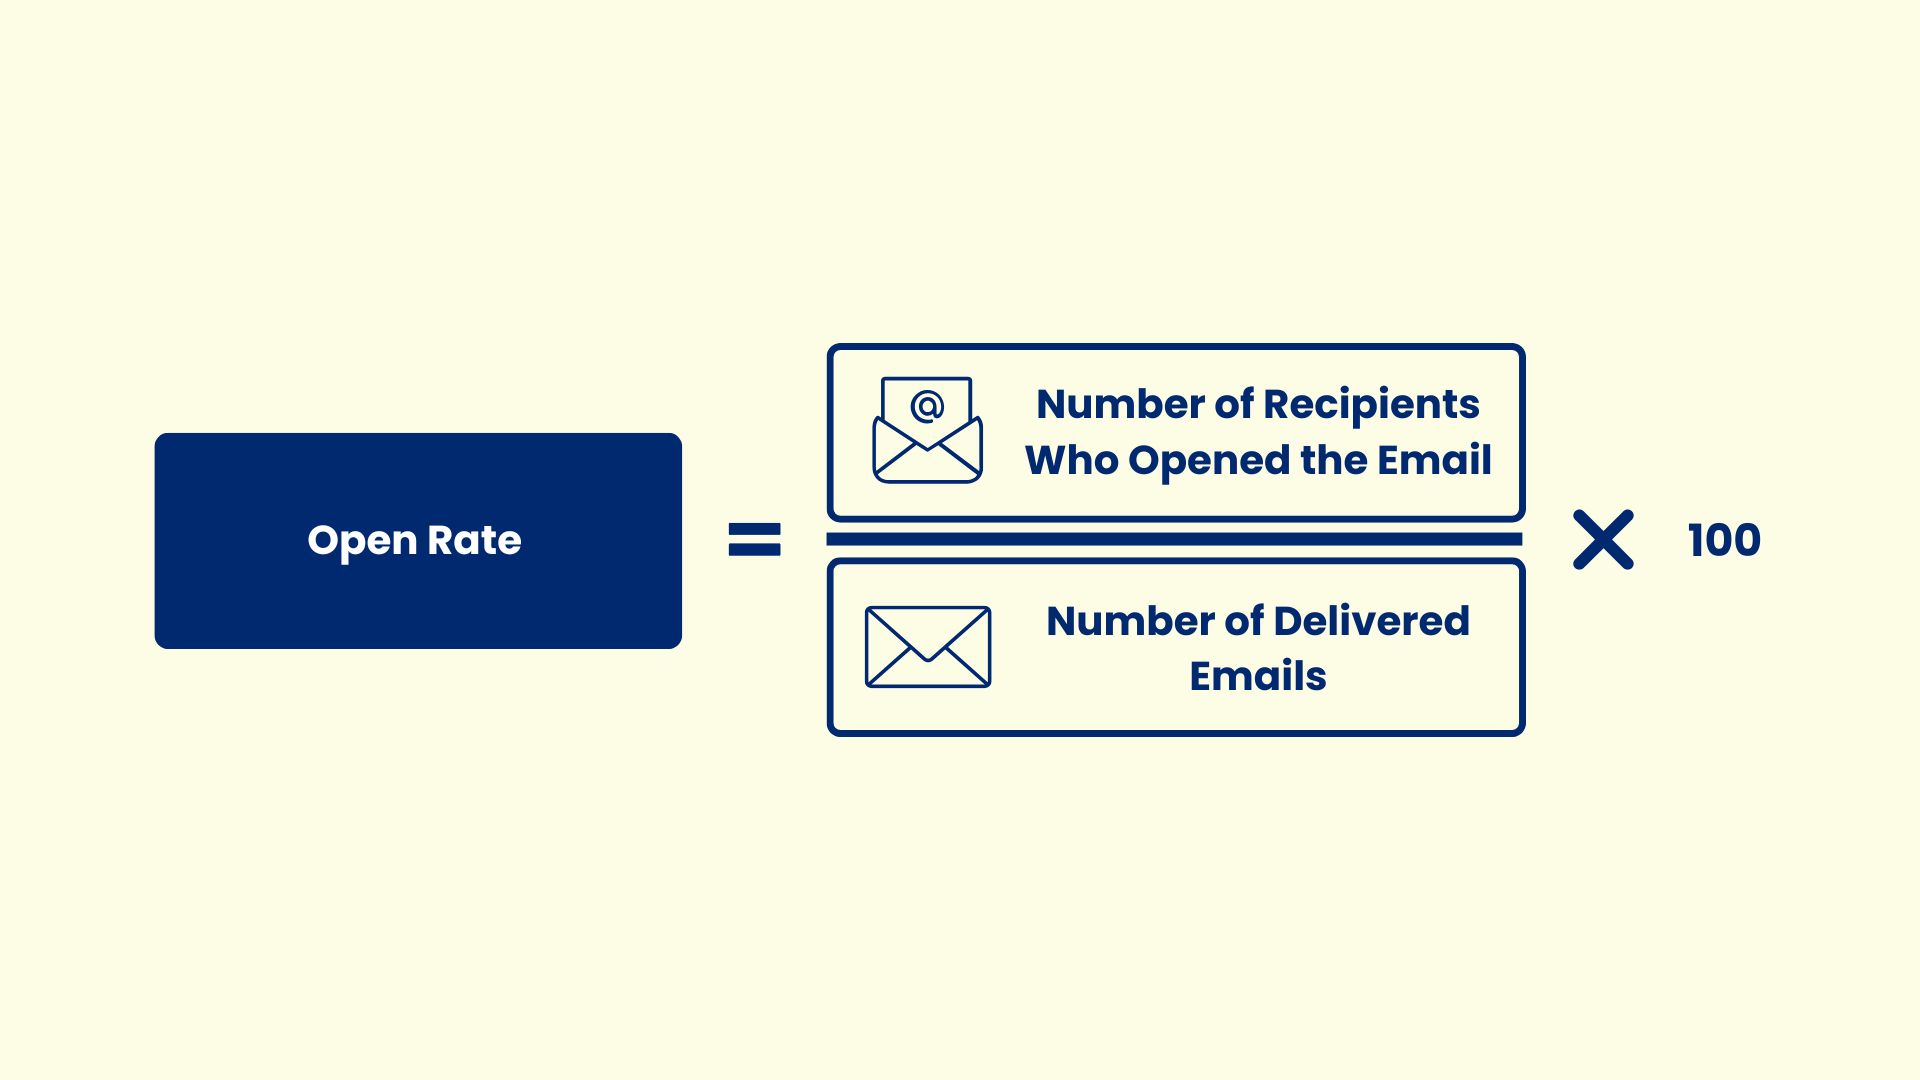
Example: If an email is delivered to 10,000 recipients and 2,800 recipients open it, the Open Rate is 28%.
However, open rate is no longer a definitive measure of engagement. Most email marketing platforms track opens using a tiny invisible image called a tracking pixel. In a standard email client, an open is recorded when a recipient opens the email and the tracking pixel is loaded.
However, modern privacy features have changed how open tracking works. Technologies such as Apple Mail Privacy Protection (MPP) automatically preload email content, including the tracking pixel, without waiting for the recipient to open the message. As a result, an email may be recorded as "opened" even if it was never actually viewed. Similarly, some enterprise email security systems scan incoming emails automatically, which can also trigger tracking pixels and record additional opens.
For this reason, open rate should be treated as a directional metric rather than a standalone measure of campaign success. A declining open rate may indicate poor subject line performance, reduced sender reputation, or issues with inbox placement. Likewise, high open rates should always be validated using Click-Through Rate (CTR), Click-to-Open Rate (CTOR), and Conversion Rate to confirm genuine subscriber engagement.
2. Click-Through Rate (CTR)
While Open Rate indicates whether an email captured attention, Click-Through Rate (CTR) measures whether recipients took the next step by clicking a link in your email. It is one of the strongest indicators of how effectively your email content and call-to-action (CTA) encourage subscriber interaction.
CTR = (Number of Recipients Who Clicked a Link ÷ Number of Delivered Emails) × 100
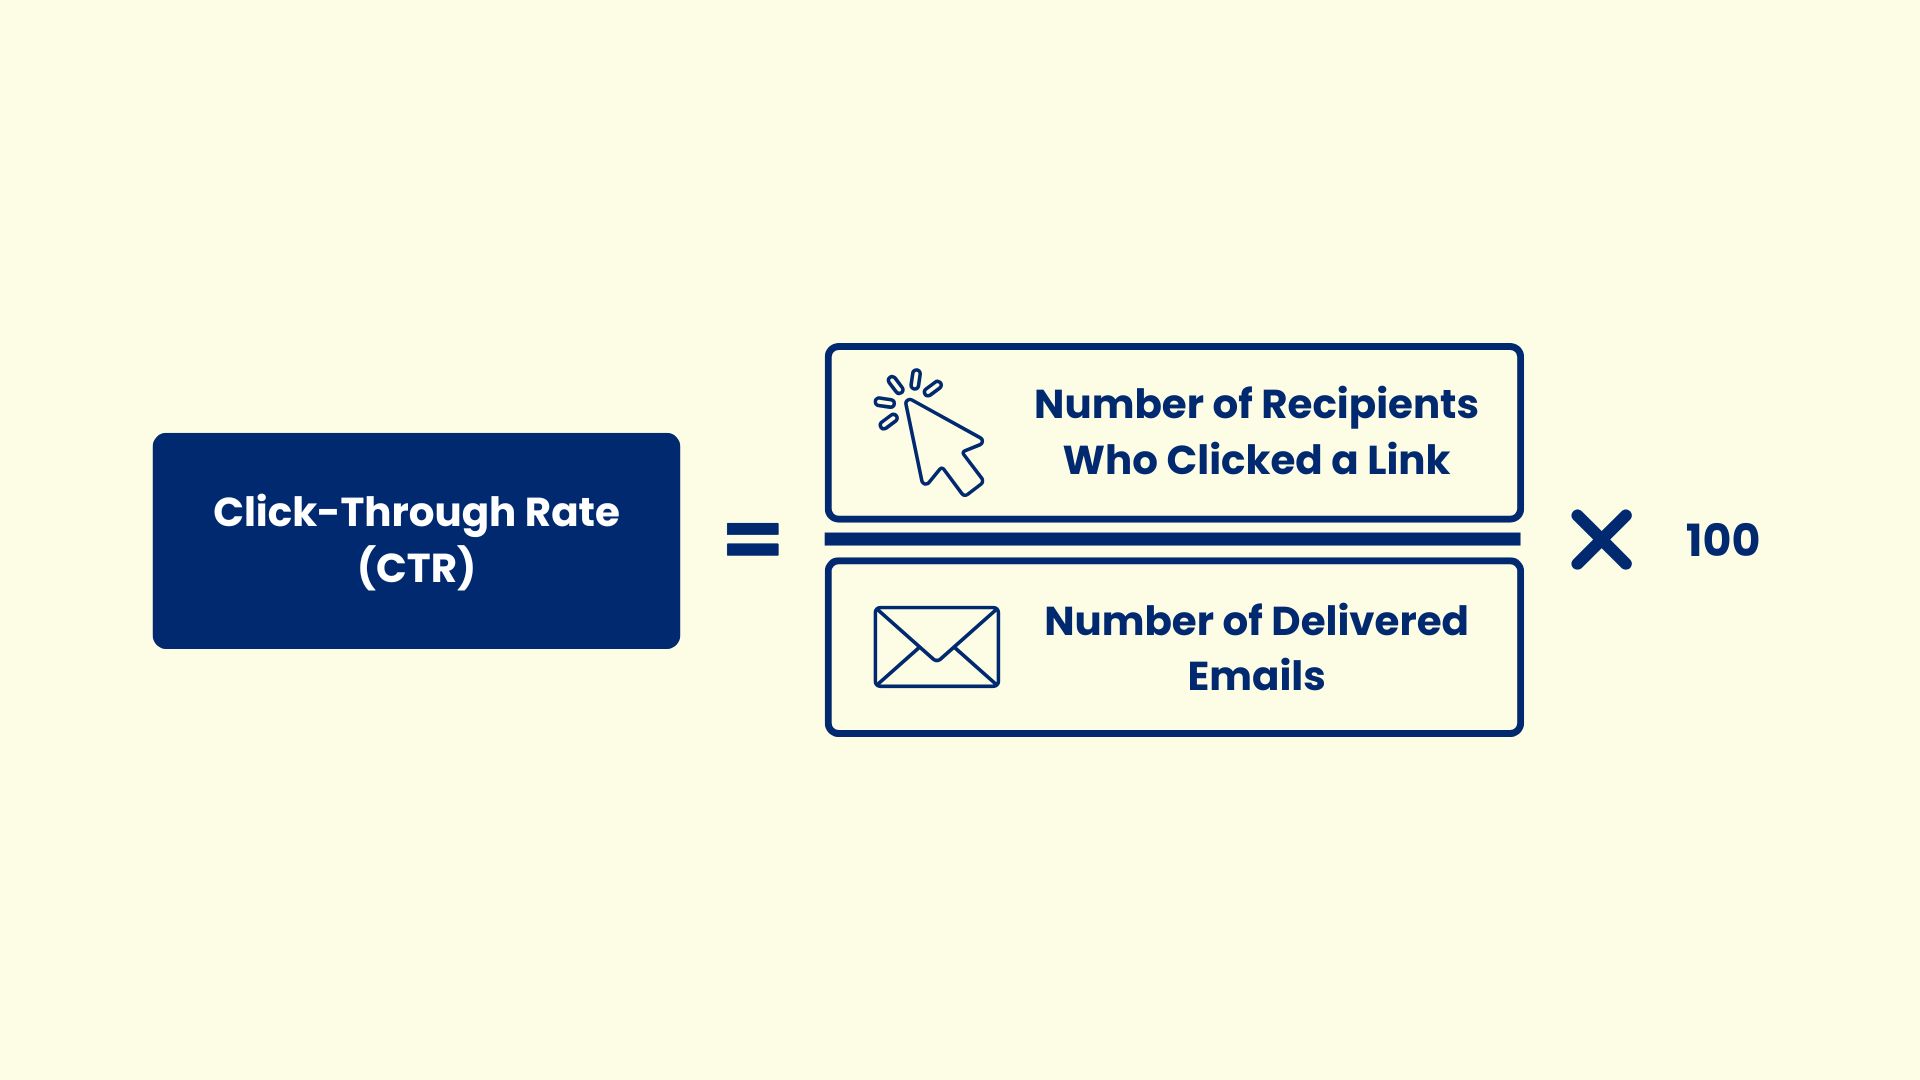
Example: If an email is delivered to 10,000 recipients and 350 recipients click a link, the CTR is 3.5%.
When someone clicks a link, it signals that your email generated enough interest for the recipient to learn more, download a resource, complete a purchase, or perform another intended action. For this reason, CTR is generally a stronger indicator of engagement than Open Rate.
However, some enterprise email security solutions, such as Microsoft Safe Links, automatically scan links before emails reach recipients to detect malicious content. These automated scans can generate clicks that do not reflect genuine subscriber engagement.
A low CTR may indicate that your email content does not match the expectations set by the subject line, the call to action is unclear, or the offer is not relevant to your audience. Improving audience segmentation, content relevance, email design, and CTA placement can help increase CTR.
Although CTR is one of the most valuable email engagement metrics, it should be evaluated alongside Click-to-Open Rate (CTOR) and Conversion Rate to understand whether recipient engagement leads to meaningful business results.
3. Click-to-Open Rate (CTOR)
While Click-Through Rate (CTR) measures clicks based on all delivered emails, Click-to-Open Rate (CTOR) measures clicks only among recipients who opened the email. This makes CTOR a valuable metric for evaluating how effectively your email content, design, and call-to-action (CTA) engage readers after the email has been opened.
CTOR = (Number of Recipients Who Clicked a Link ÷ Number of Recipients Who Opened the Email) × 100
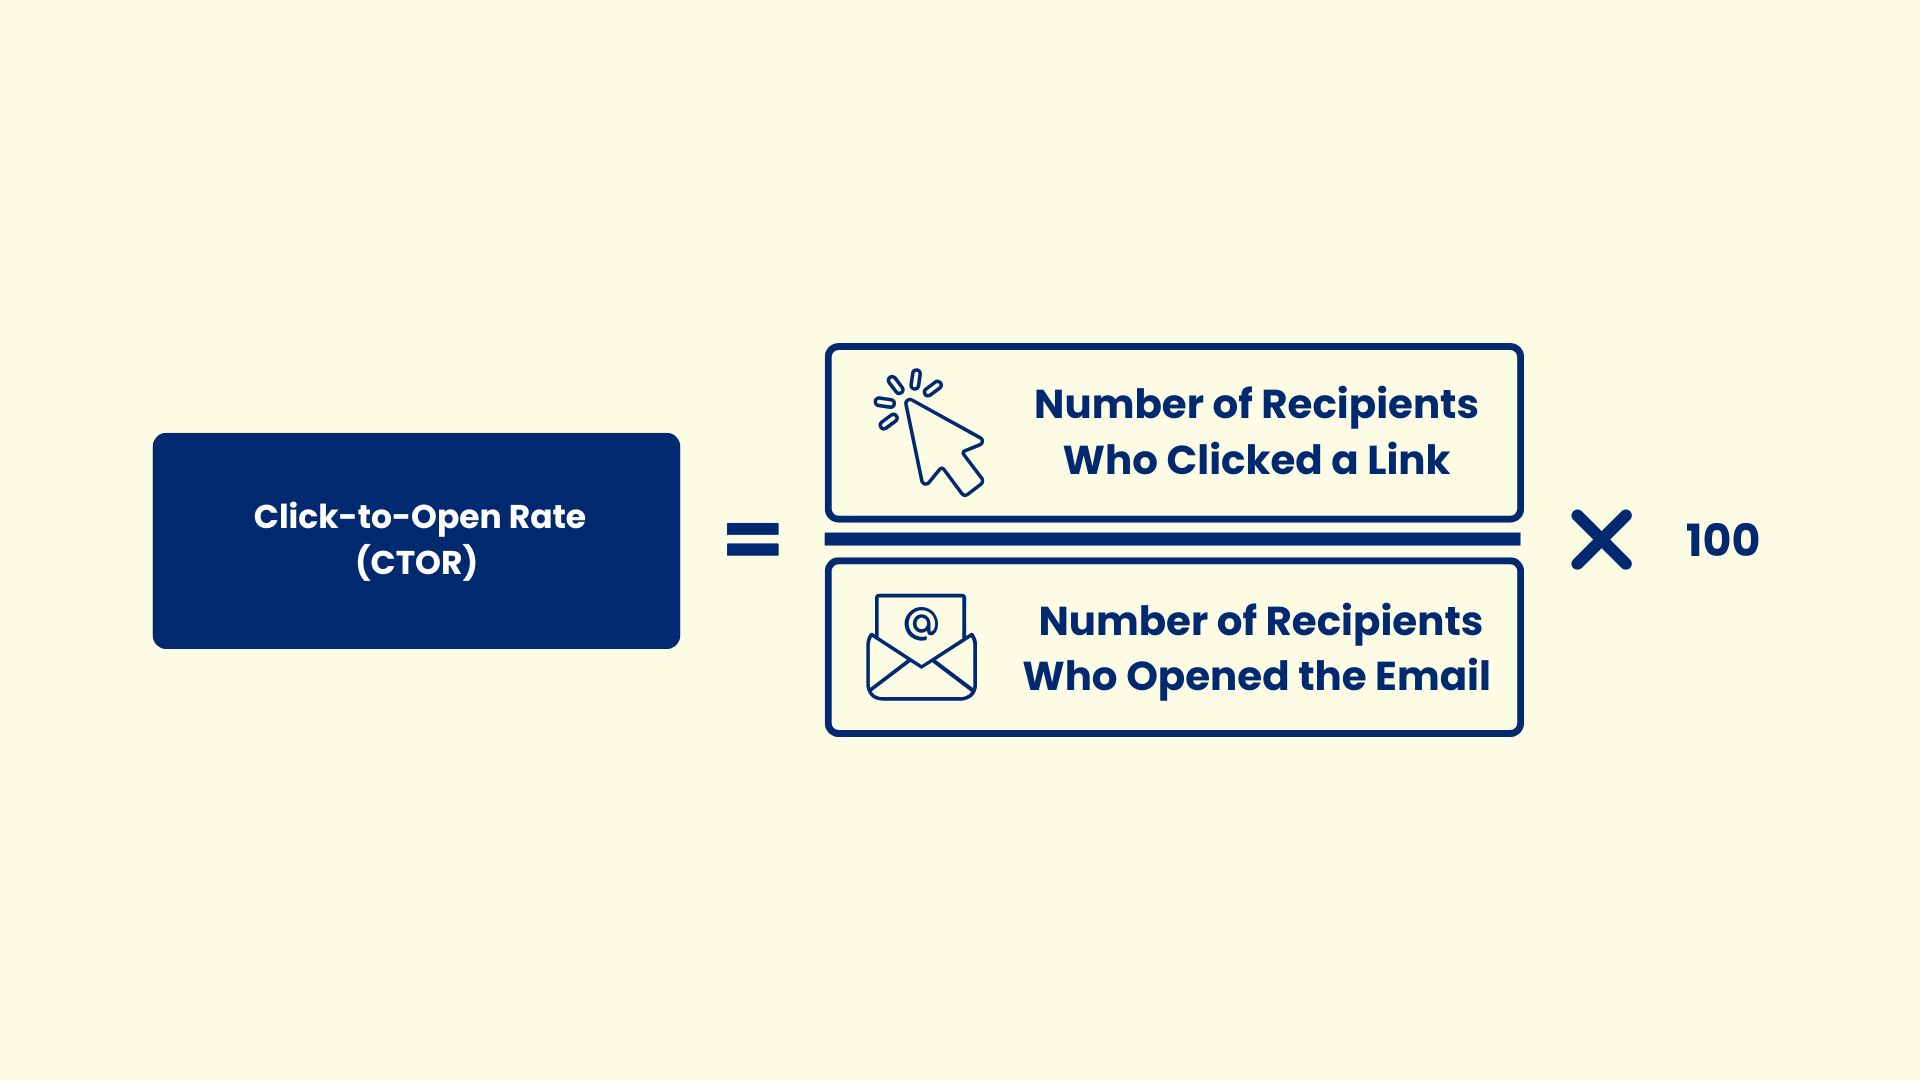
Example: If 2,800 recipients open an email and 350 recipients click a link, the CTOR is 12.5%.
CTOR focuses on what happens after the email is opened. A strong CTOR generally indicates that your content is relevant, your message is clear, and your CTA successfully encourages recipients to take action.
However, CTOR uses Open Rate in its calculation. Since technologies such as Apple Mail Privacy Protection (MPP) can artificially increase recorded opens, CTOR should be analyzed together with CTR and Conversion Rate.
A low CTOR suggests that your email captured attention but failed to encourage recipients to take action. This may be caused by unclear messaging, a weak CTA, or content that is not relevant to your audience. Improving content quality and CTA placement can help increase CTOR.
| Metric | What It Measures |
|---|---|
| Click-Through Rate (CTR) | Out of all delivered emails, how many recipients clicked a link? |
| Click-to-Open Rate (CTOR) | Out of the recipients who opened the email, how many clicked a link? |
4. Unsubscribe Rate
While engagement metrics such as Open Rate, CTR, and CTOR indicate positive subscriber interactions, Unsubscribe Rate measures the percentage of recipients who choose to opt out of receiving future emails. It helps businesses understand whether their email frequency, content, or targeting aligns with subscriber expectations.
Unsubscribe Rate = (Number of Unsubscribes ÷ Number of Delivered Emails) × 100
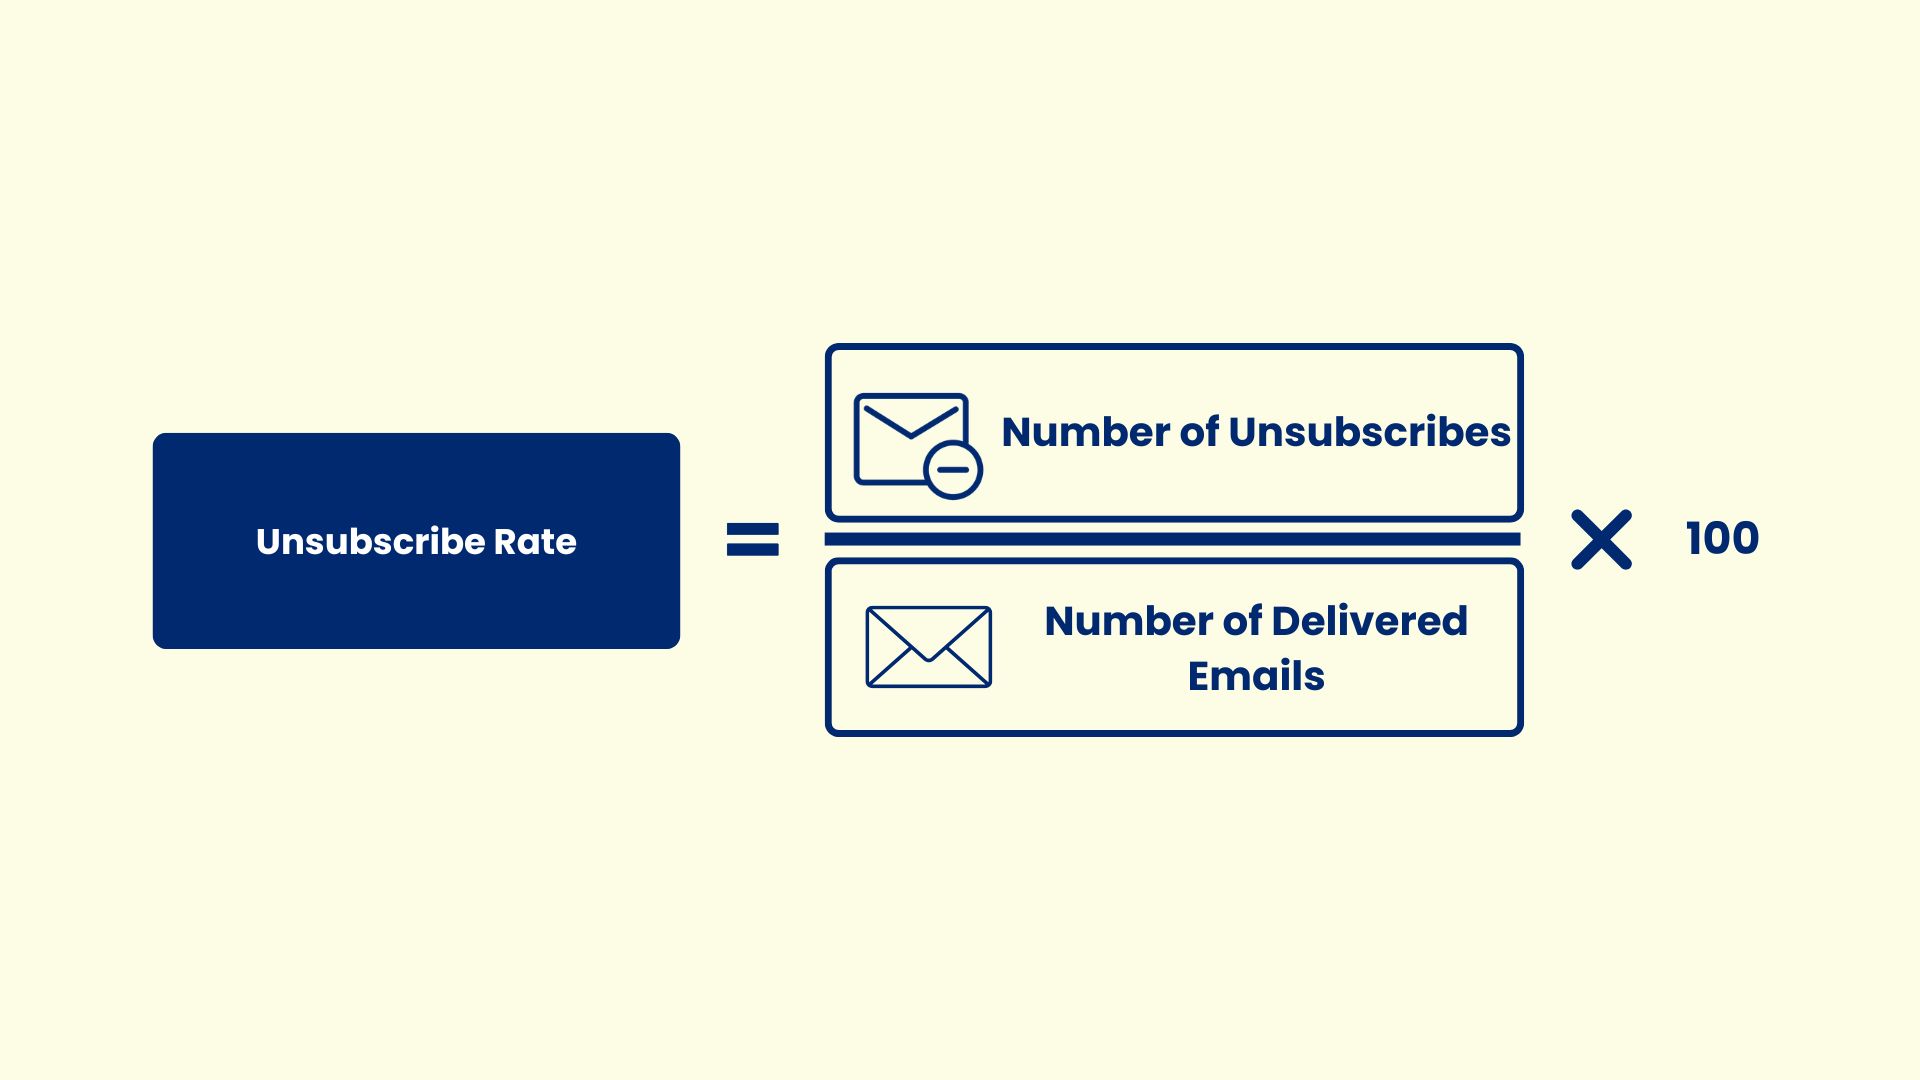
Example: If an email is delivered to 10,000 recipients and 25 recipients unsubscribe, the Unsubscribe Rate is 0.25%.
Every unsubscribe is not necessarily a negative outcome. Subscribers may opt out because their interests have changed or they no longer require your products or services. However, a sudden increase in unsubscribe rate often indicates that your emails are not meeting subscriber expectations.
A high unsubscribe rate may result from sending emails too frequently, delivering content that is not relevant to the audience, or setting unrealistic expectations during the sign-up process. Improving audience segmentation, personalizing email content, and maintaining a consistent sending frequency can help reduce unsubscribe rates.
Although consistently monitoring unsubscribe rates helps businesses evaluate audience satisfaction and maintain a healthier, more engaged email list.
Email Deliverability Metrics
Email deliverability metrics measure how successfully your emails reach recipients and where they are placed after delivery. Unlike engagement metrics, which evaluate subscriber interactions, deliverability metrics assess the technical health of your email program.
Monitoring these metrics helps identify why emails reach the inbox, land in the spam folder, or fail to reach recipients altogether.
5. Inbox Placement Rate
Many marketers assume that a high Delivery Rate means their emails successfully reached subscribers. In reality, Delivery Rate and Inbox Placement Rate measure two different things.
Inbox Placement Rate (IPR) measures the percentage of delivered emails that are placed in the recipient's inbox rather than the spam or junk folder. Since recipients are unlikely to engage with emails they never see, Inbox Placement Rate is one of the most important indicators of email deliverability.
Inbox Placement Rate = (Number of Emails Delivered to the Inbox ÷ Number of Delivered Emails) × 100
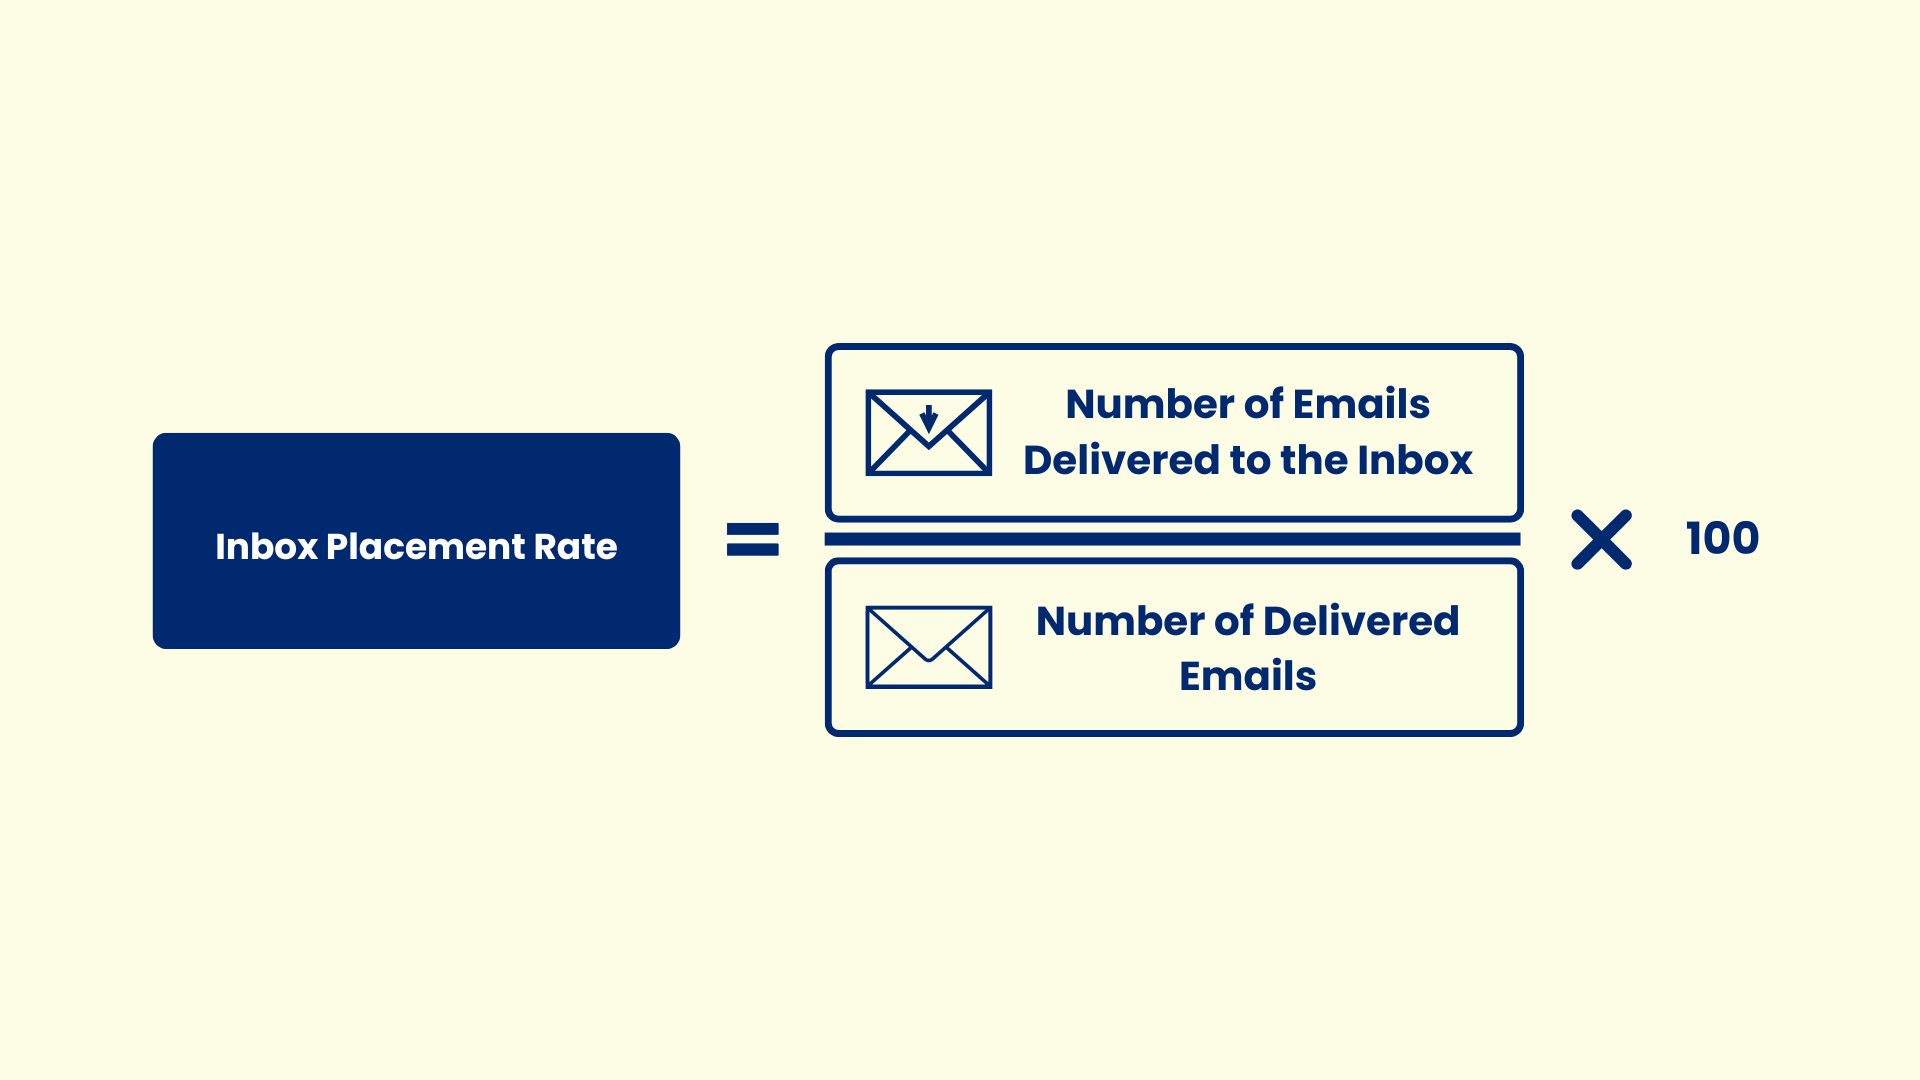
Example: If 9,800 emails are delivered and 9,000 emails reach the inbox, the Inbox Placement Rate is approximately 91.8%.
Inbox Placement Rate is influenced by factors such as sender reputation, email authentication (SPF, DKIM, and DMARC), complaint rates, list quality, and subscriber engagement. Monitoring these signals and following email deliverability best practices can help improve inbox placement.
Expert Insight
"The metric I'd pay closest attention to is inbox placement rate by provider. Delivered only means the receiving server accepted the email—it doesn't mean the message reached the inbox. I recommend monitoring inbox placement separately for Gmail, Outlook, Yahoo, and Apple Mail. A campaign can appear healthy overall while performing poorly with Microsoft 365, which is especially important for B2B senders."
— Jacob Sherman, Email Deliverability Expert, Sherman Digital Co.
6. Delivery Rate
Delivery Rate measures the percentage of emails successfully accepted by recipient mail servers. It indicates whether an email was delivered, not rejected or bounced, during delivery.
Delivery Rate = (Number of Delivered Emails ÷ Number of Emails Sent) × 100
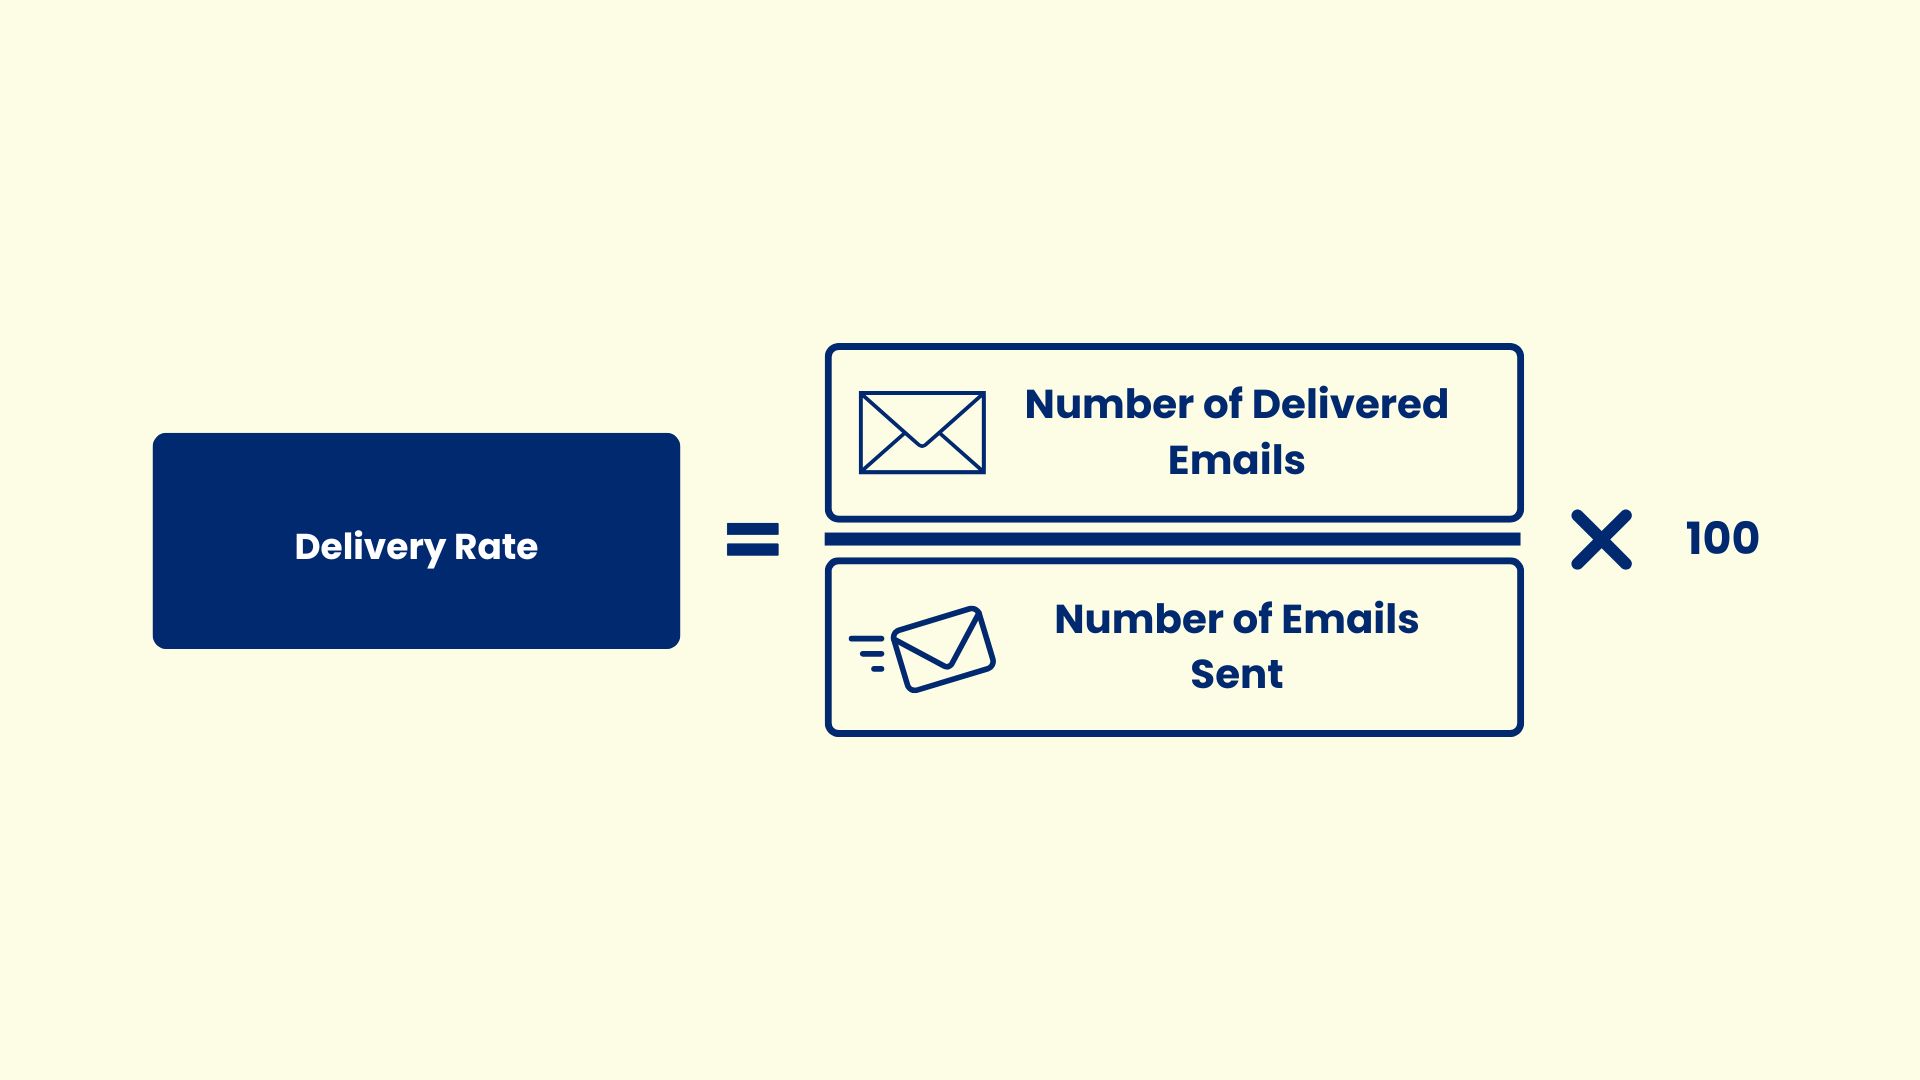
Example: If 10,000 emails are sent and 9,800 emails are successfully delivered, the Delivery Rate is 98%.
A high Delivery Rate indicates that most emails were accepted by receiving mail servers. However, it does not guarantee that those emails reached the inbox. Delivered emails may still be filtered into the spam or junk folder, which is why Delivery Rate should always be evaluated along with Inbox Placement Rate.
Low Delivery Rates are typically caused by invalid email addresses, hard bounces, temporary server issues, poor sender reputation, or authentication problems. Regular email verification, proper email authentication, and good list hygiene help improve Delivery Rate and reduce bounce rates.
7. Bounce Rate
Bounce Rate measures the percentage of emails that were not successfully delivered. It helps identify messages that were rejected by the receiving mail server and did not reach the recipient's inbox.
Bounce Rate = (Number of Bounced Emails ÷ Number of Emails Sent) × 100
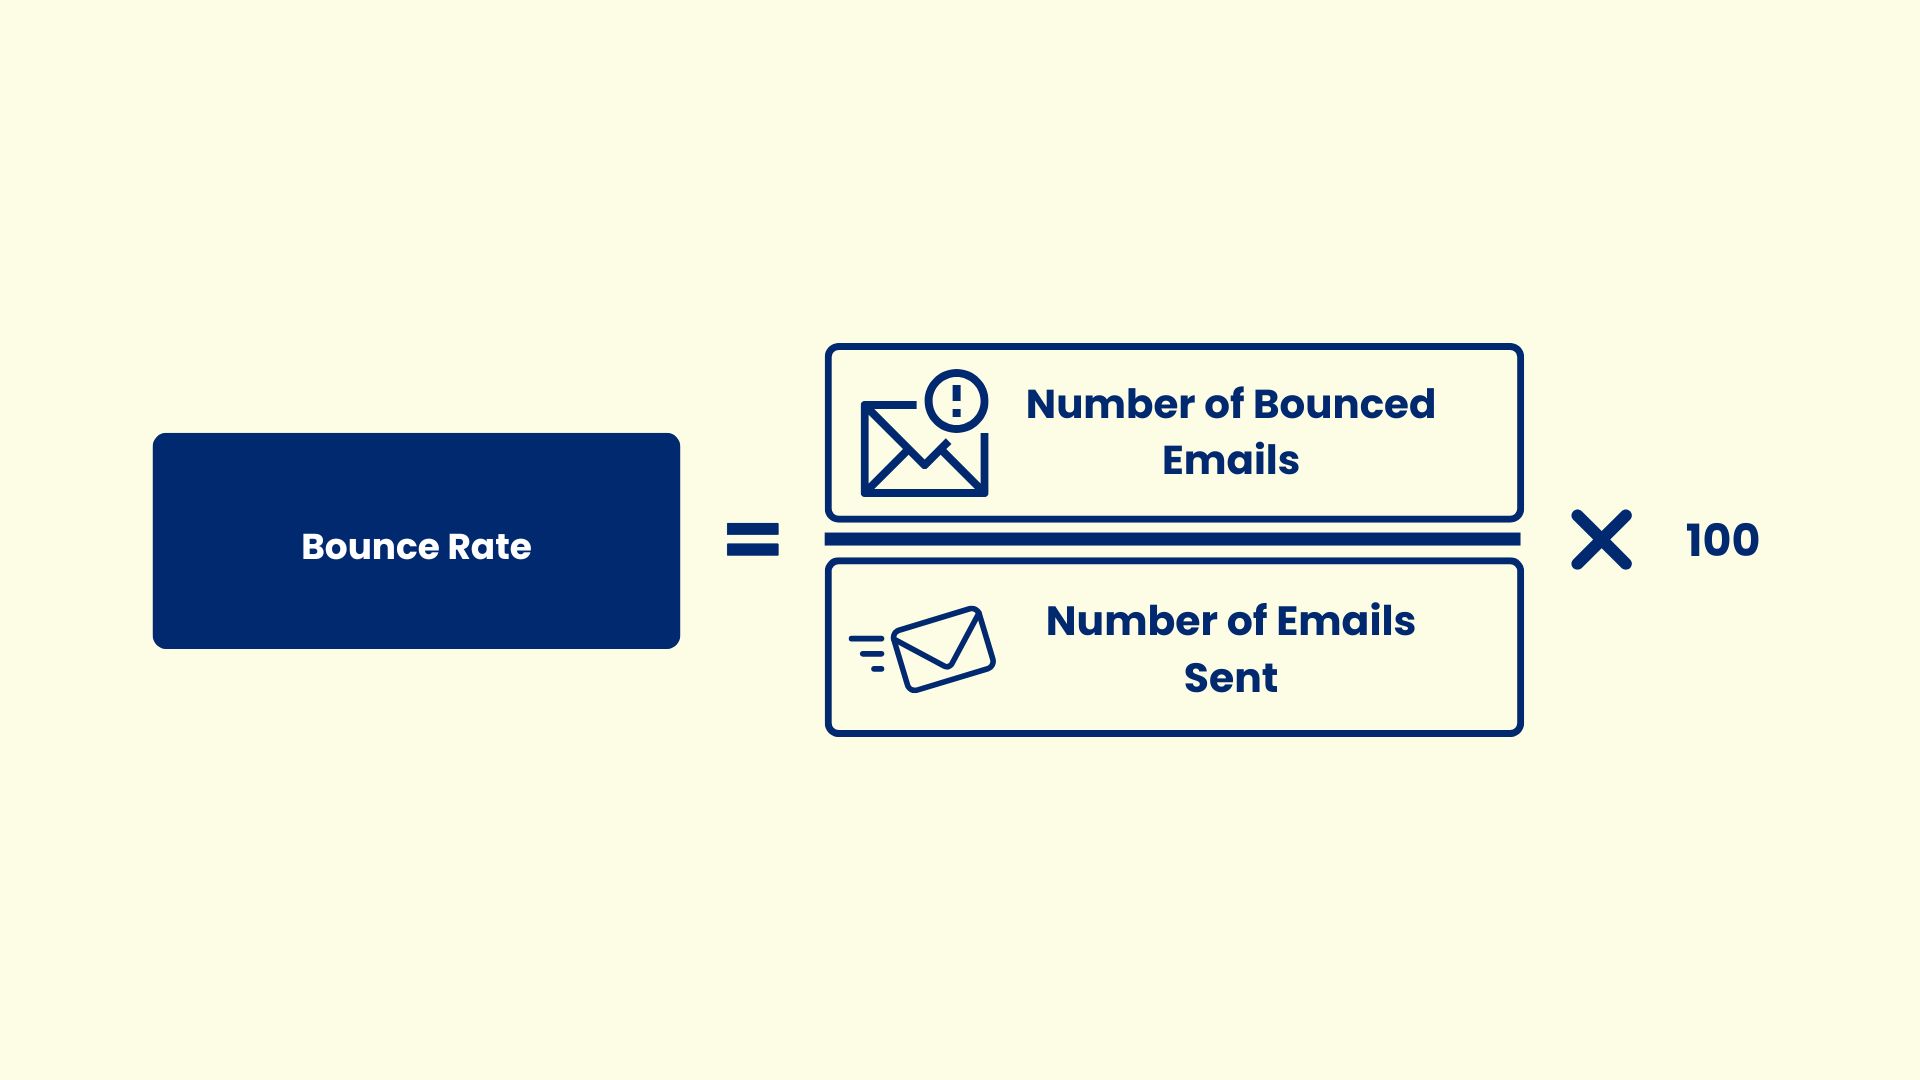
Example: If 10,000 emails are sent and 200 emails bounce, the Bounce Rate is 2%.
There are two types of email bounces:
- Hard Bounce: A permanent delivery failure caused by invalid or non-existent email addresses, inactive domains, or blocked recipients.
- Soft Bounce: A temporary delivery failure caused by issues such as a full mailbox, a temporary server outage, or an email message exceeding the recipient's size limit.
While occasional soft bounces are normal, a high number of hard bounces is a strong indicator of poor email list quality. Consistently high bounce rates can damage your sender reputation and reduce future inbox placement.
Regular email verification, removing invalid email addresses, and maintaining a clean email list help minimize bounce rates and improve overall deliverability.
8. Spam Complaint Rate
Spam Complaint Rate measures the percentage of delivered emails that recipients mark as spam or junk. It is one of the strongest signals mailbox providers use to evaluate sender reputation and determine future inbox placement.
Spam Complaint Rate = (Number of Spam Complaints ÷ Number of Delivered Emails) × 100
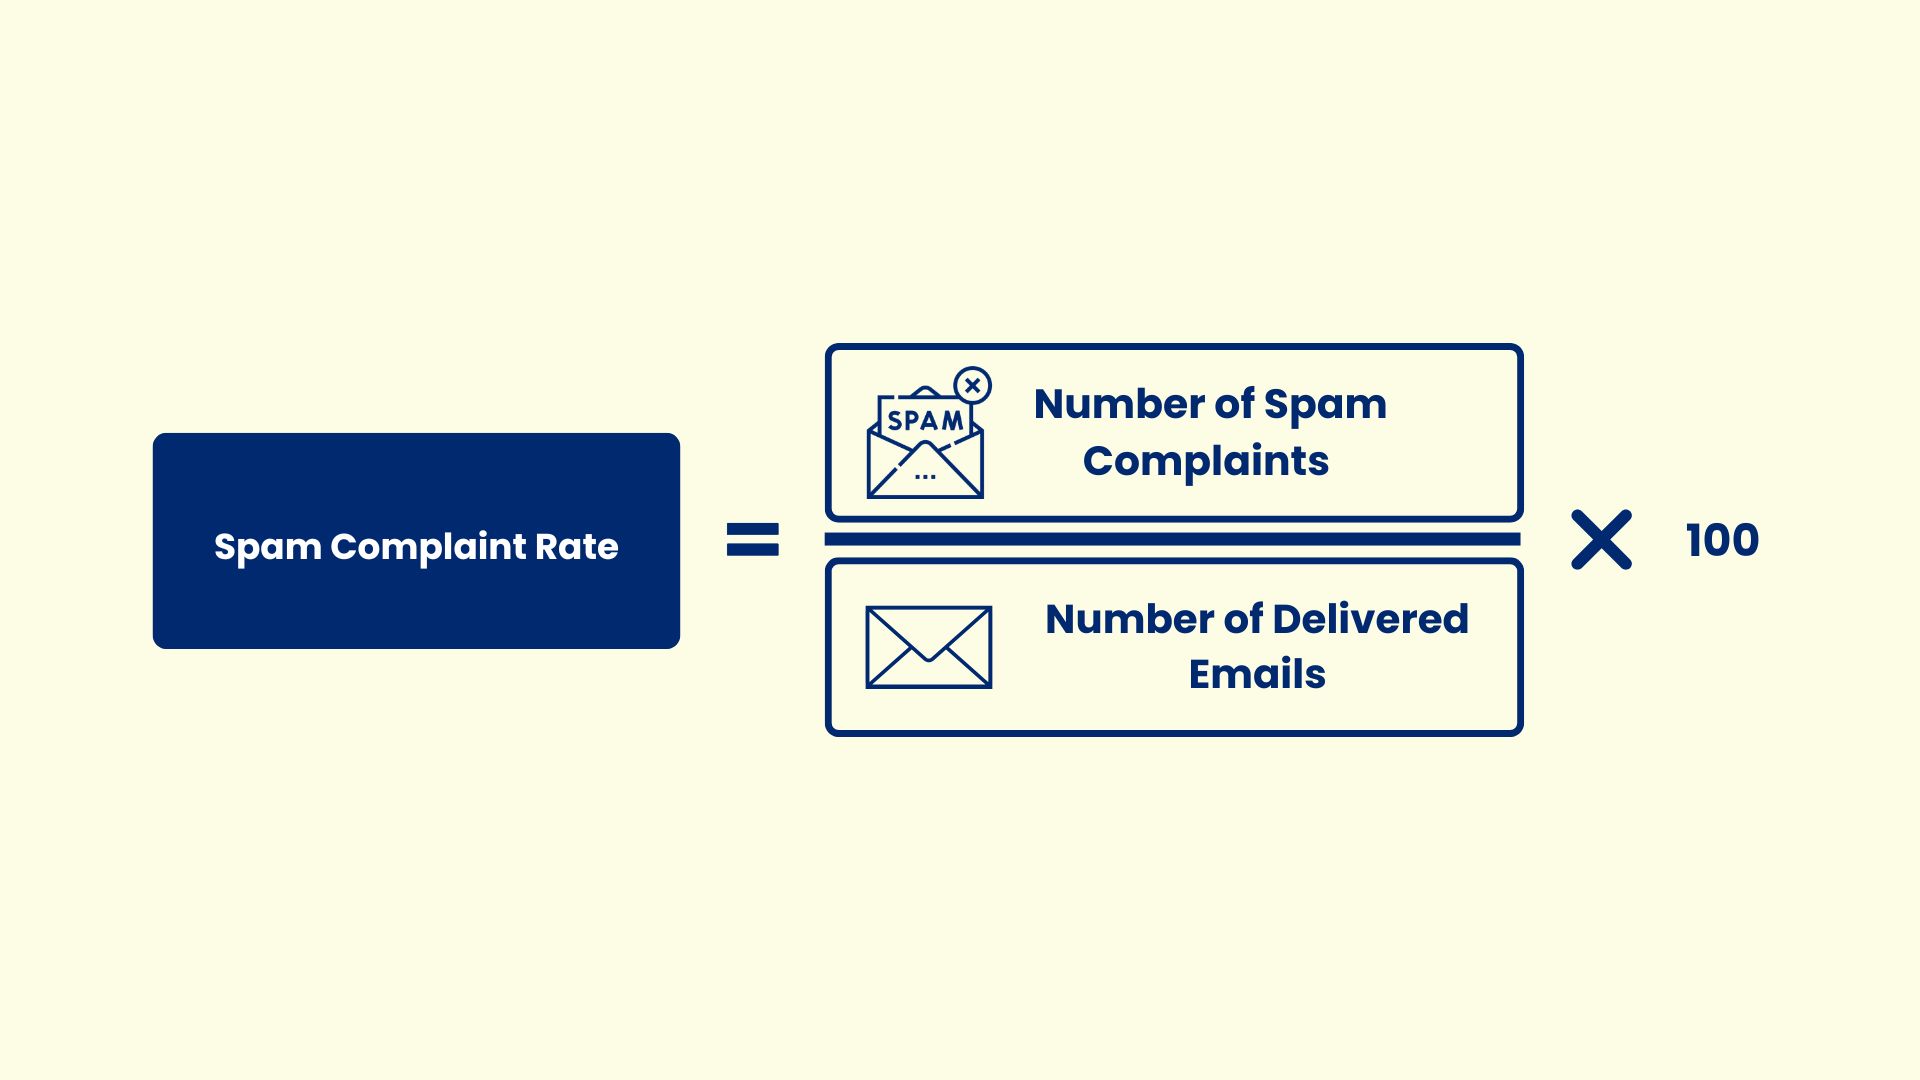
Example: If 10,000 emails are delivered and 8 recipients mark the email as spam, the Spam Complaint Rate is 0.08%.
Mailbox providers such as Gmail, Outlook, and Yahoo closely monitor spam complaints. Even a small increase can negatively affect sender reputation, causing future emails to be filtered into the spam folder or blocked entirely.
High spam complaint rates are often caused by sending emails without clear subscriber consent, emailing inactive contacts, sending irrelevant content, or sending too frequently. Setting clear expectations during sign-up, maintaining a clean email list, segmenting audiences, and providing relevant content can help reduce spam complaints.
Although every sender may receive occasional spam complaints, consistently keeping complaint rates low is essential for maintaining strong deliverability and protecting sender reputation.
Email Business Metrics
While engagement and deliverability metrics measure how recipients interact with your emails and whether they reach the inbox, email business metrics evaluate the impact of your campaigns on business objectives. These metrics help determine whether your email marketing efforts are generating leads, conversions, revenue, and return on investment.
Tracking business metrics helps connect email performance with measurable outcomes, making it easier to evaluate the effectiveness of your overall email marketing strategy.
9. Conversion Rate
Conversion Rate measures the percentage of recipients who take a desired action after clicking an email link. Depending on your campaign objective, a conversion may include making a purchase, submitting a form, downloading a resource, registering for a webinar, or starting a free trial.
Conversion Rate = (Number of Conversions ÷ Number of Delivered Emails) × 100
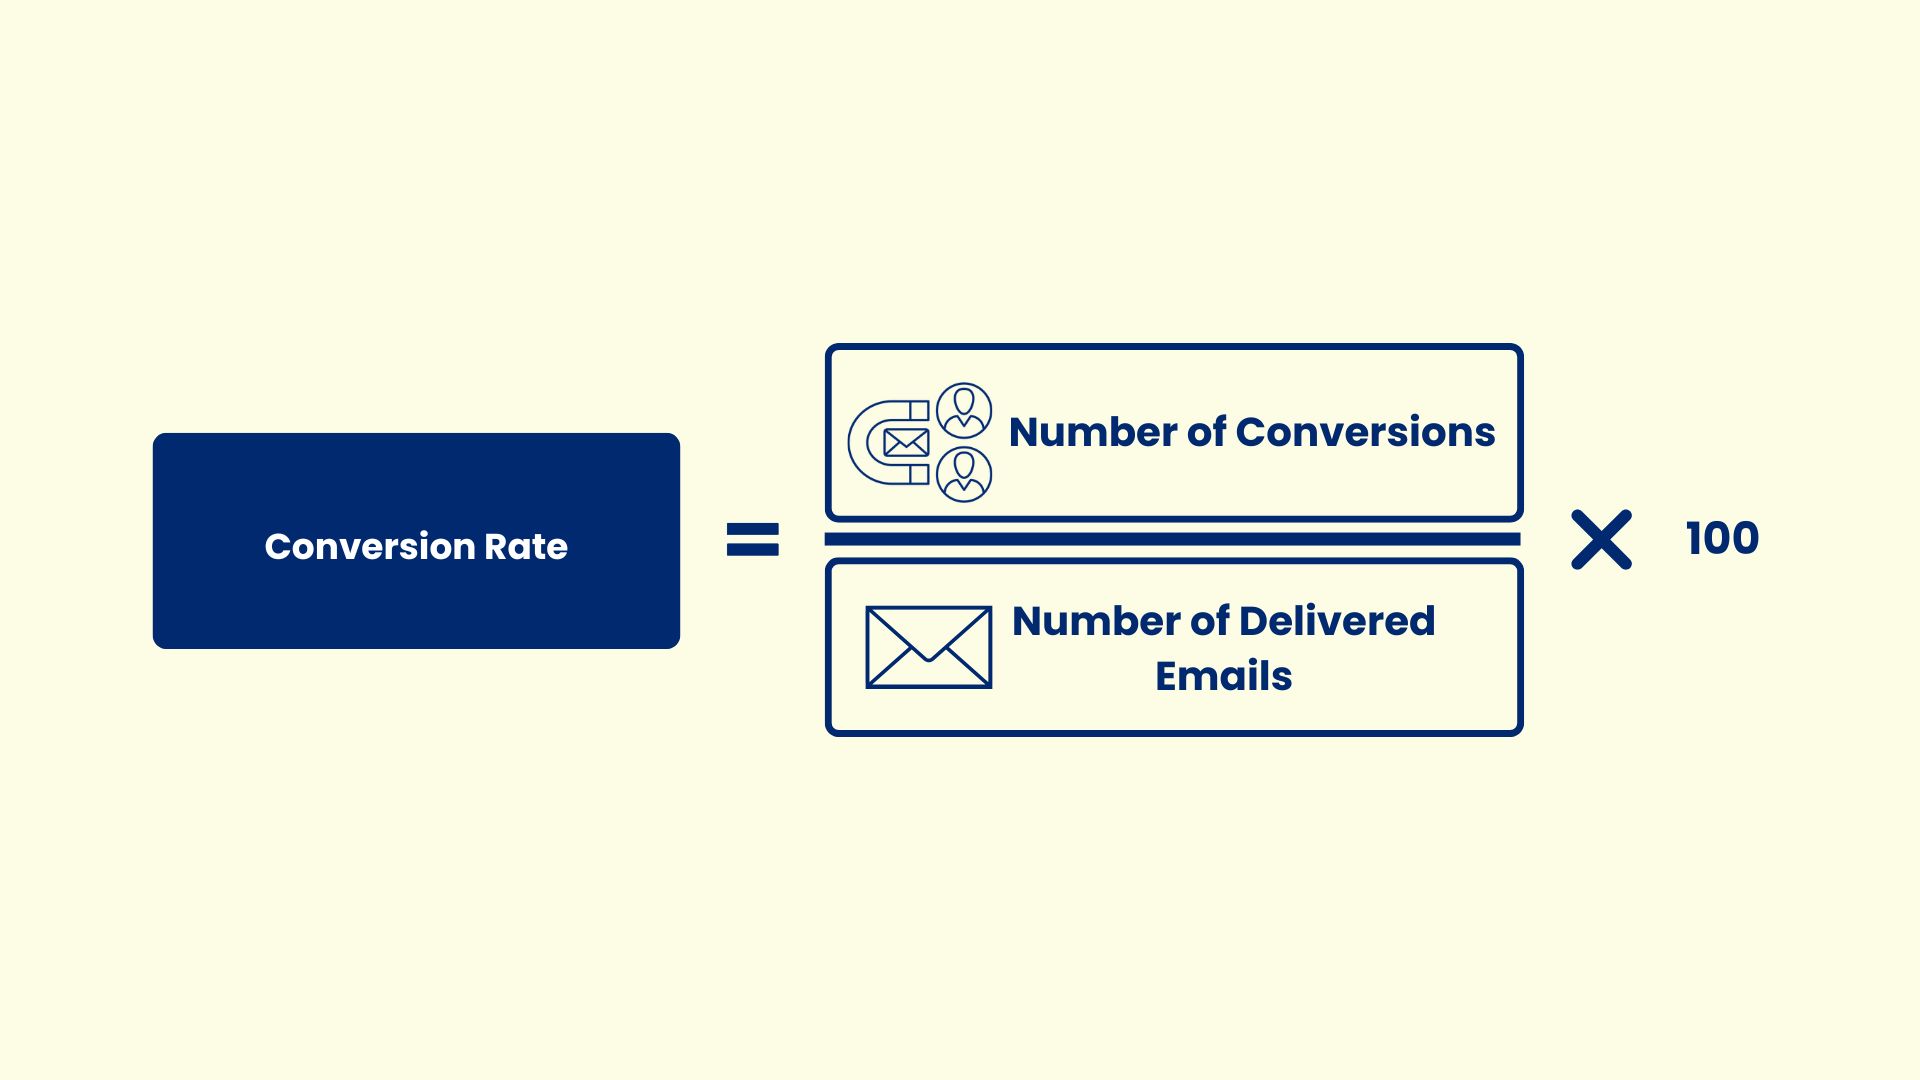
Example: If 10,000 emails are delivered and 250 recipients complete the desired action, the Conversion Rate is 2.5%.
A campaign may generate high open rates and CTR, but if recipients do not complete the intended action, the campaign has limited business impact.
A low Conversion Rate may indicate that the landing page, offer, or overall customer journey does not meet recipient expectations. Improving audience targeting, aligning email content with landing pages, simplifying the conversion process, and optimizing calls to action can help increase conversions.
Because Conversion Rate directly measures campaign effectiveness, it is one of the most valuable metrics for evaluating email marketing success.
10. Revenue Per Email (RPE)
Revenue Per Email (RPE) measures the average revenue generated by each delivered email. It helps businesses evaluate the financial performance of their email campaigns and compare the effectiveness of different campaigns, audience segments, and marketing strategies.
Revenue Per Email (RPE) = Total Revenue Generated ÷ Number of Delivered Emails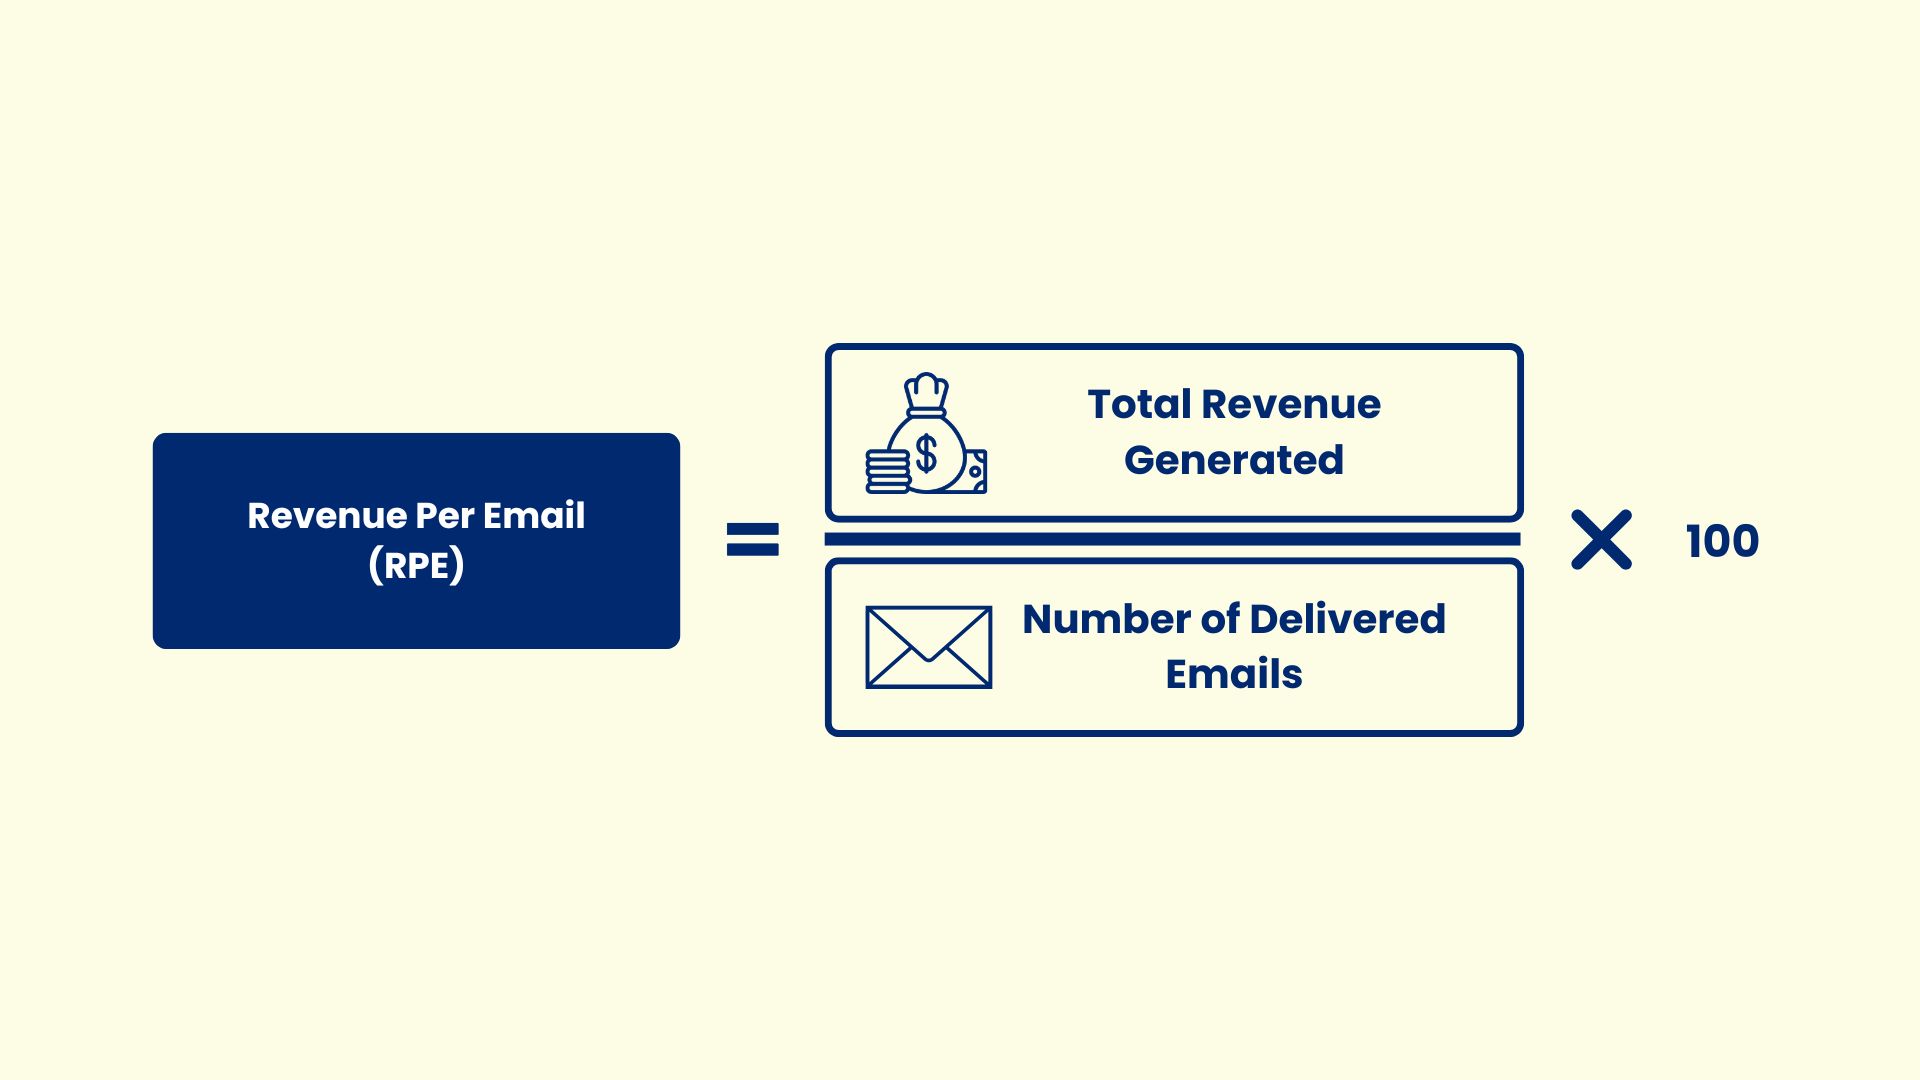
Example: If an email campaign generates $5,000 in revenue from 10,000 delivered emails, the Revenue Per Email is $0.50.
A campaign with fewer opens or clicks can still generate higher revenue if it reaches the right audience and encourages high-value purchases.
A low Revenue Per Email may indicate poor audience targeting, weak offers, low conversion rates, or an ineffective post-click experience. Improving audience segmentation, personalization, product recommendations, and landing page optimization can help increase revenue per email.
11. Return on Investment (ROI)
Return on Investment (ROI) measures the profitability of your email marketing campaigns by comparing the revenue generated with the total cost of running the campaign. It helps businesses determine whether their email marketing efforts are delivering a positive financial return.
Return on Investment (ROI) = [(Revenue Generated − Campaign Cost) ÷ Campaign Cost] × 100
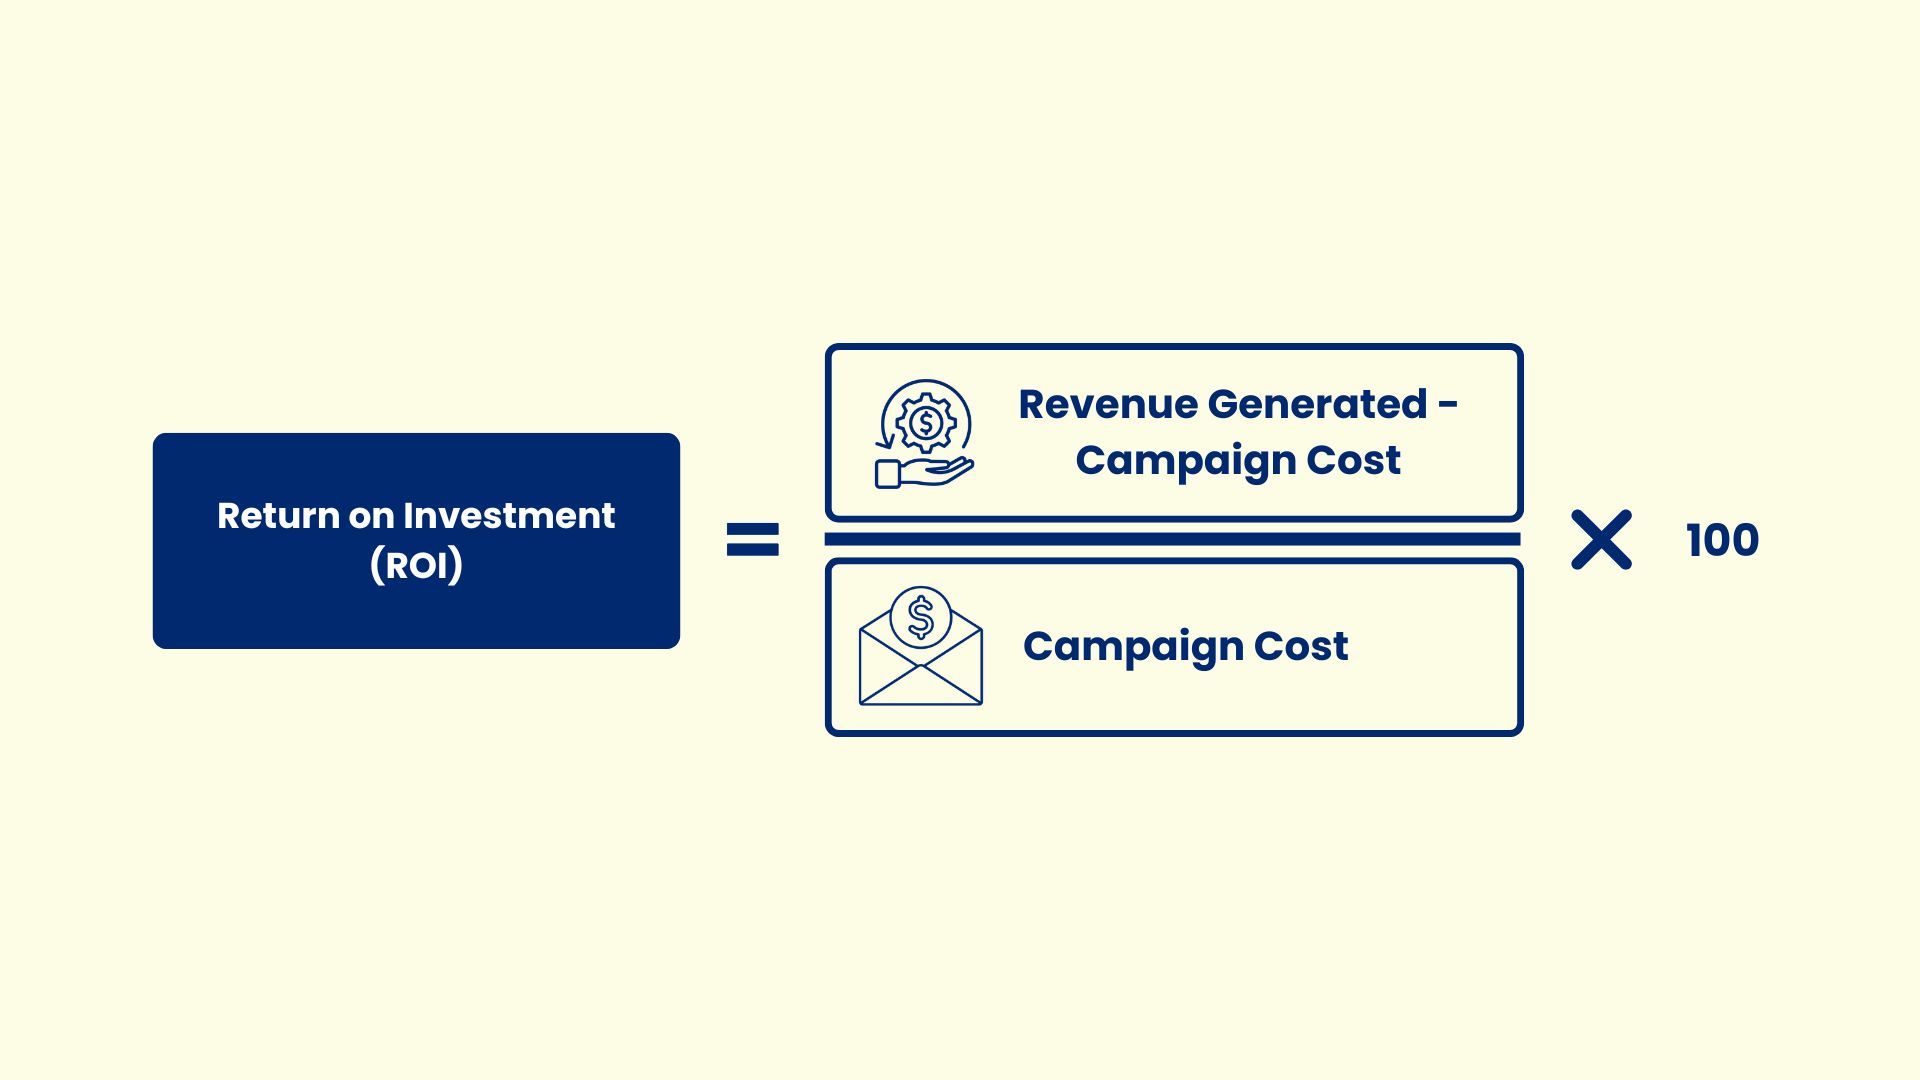
Example: If an email campaign generates $10,000 in revenue and costs $2,000 to create and send, the ROI is 400%. This means the campaign generated $4 in profit for every $1 invested.
ROI provides a broader measure of campaign success than engagement or conversion metrics alone. A campaign may achieve high open rates and click-through rates, but if it generates little revenue or costs too much to execute, the overall return may be low.
Improving ROI involves optimizing the entire email marketing process, from maintaining a high-quality email list and improving deliverability to increasing conversions and maximizing revenue per campaign.
Where Can You Monitor Email Marketing Metrics?
Most email marketing platforms provide built-in analytics dashboards where you can monitor campaign performance. Metrics such as Open Rate, CTR, CTOR, Delivery Rate, Bounce Rate, Unsubscribe Rate, and Conversion Rate are typically available within platforms like Mailchimp, HubSpot, Klaviyo, ActiveCampaign, Brevo, and Campaign Monitor.
However, some deliverability metrics such as Inbox Placement Rate, sender reputation, and domain authentication status often require specialized deliverability tools or mailbox provider services. For example, marketers commonly use Google Postmaster Tools, Microsoft SNDS, inbox placement testing platforms, and email verification tools to gain deeper insights into email deliverability.
Which Email Marketing Metrics Should You Prioritize?
Every email marketing metric you prioritize should align with your campaign objectives. Rather than focusing on a single metric, evaluate engagement, deliverability, and business metrics together to gain a more complete understanding of campaign performance.
The table below highlights the key metrics to prioritize for common email marketing goals.
| Campaign Goal | Primary Metrics to Prioritize |
|---|---|
| Improve inbox placement | Inbox Placement Rate, Delivery Rate, Bounce Rate, Spam Complaint Rate |
| Increase subscriber engagement | CTR, CTOR, Reply Rate, Unsubscribe Rate |
| Increase conversions | Conversion Rate, Revenue Per Email (RPE), ROI |
| Maintain email list quality | Bounce Rate, Spam Complaint Rate, Unsubscribe Rate |
| Measure overall campaign success | Inbox Placement Rate, CTR, Conversion Rate, ROI |
Bottom Line
Strong email marketing performance comes from understanding how deliverability, engagement, and conversion metrics work together. Analyzing these metrics together helps you identify what's driving results, where campaigns need improvement, and which areas to optimize.
Rather than chasing individual metrics, focus on improving overall campaign performance. This approach helps you build healthier email lists, improve deliverability, increase engagement, and achieve better business results.